
Two Forces, Four Markets: Australian Housing in a Rate-Reversal Year
HCP Insight | March 2026
The Macro Setting
The easing cycle of 2025 has proven short-lived. Following three rate cuts, the RBA has resumed tightening, with February and March 2026 increases reversing earlier policy accommodation. Market consensus now anticipates a return to approximately 4.35% by mid-year, effectively revisiting the prior cycle peak.
For private credit, the transmission mechanism is immediate. Floating-rate instruments reprice in line with base rate movements, with no requirement for renegotiation. Facilities priced at BBSW + 500 basis points have moved from yields of approximately 8.6% in mid-2025 to nearer 9.3% today. This dynamic underpins the current income narrative.
However, the borrower-side implications are more complex. Housing affordability has deteriorated materially across multiple measures. National dwelling values have risen approximately 47% since March 2020, compared to income growth of roughly 15%. Before the recent rate rises, mortgage servicing absorbed approximately 45% of median household income, while deposit accumulation periods nationally now routinely exceed a decade – and materially longer in Sydney.
The structural case remains intact. Australia continues to face a meaningful housing shortfall, with cumulative undersupply estimated in the range of 200,000 to 300,000 dwellings. Population growth continues to outpace completions, and construction capacity remains constrained. These factors will underpin asset values over the medium term.
But this should not be mistaken for unconstrained upside. Affordability has become the binding constraint, and it is inherently rate-sensitive.
Economic Context and Housing Supply
The tables below compare current twelve-month readings across four target markets - being Victoria, New South Wales, Queensland and the ACT - against the 2009–2019 decade average, which serves as a proxy for normalised market conditions. The contrast is instructive.
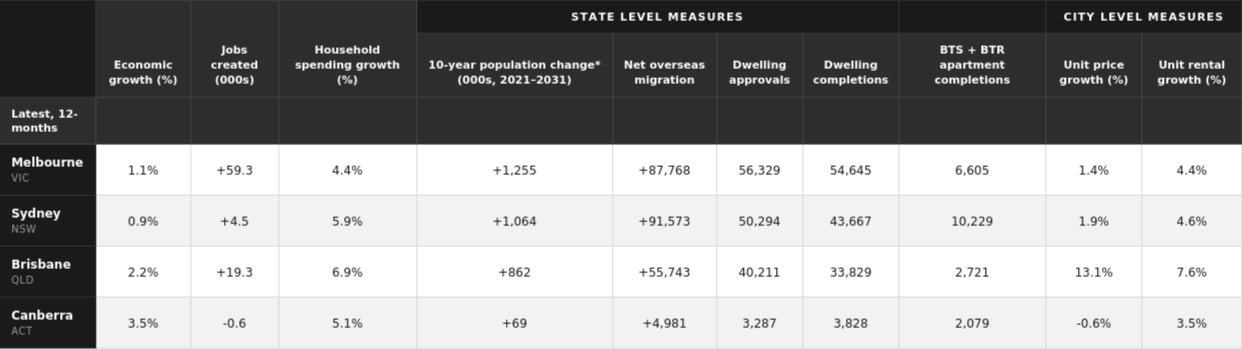
* Projection
Sources: Sources: ABS, Centre for Population, Charter Keck Cramer, SQM. Corelogic
** Total change over 10 years
Note: past performance is not an indicator of future performance.
Sources: ABS, Centre for Population, Charter Keck Cramer, SQM. Corelogic
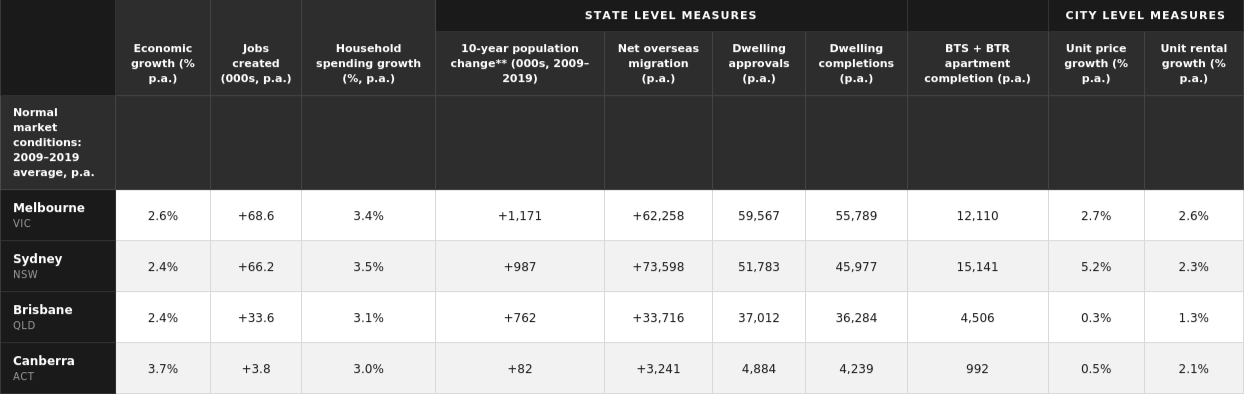
Several observations warrant emphasis. Net overseas migration across all four markets is running materially above pre-COVID, decade-average levels, most acutely in Sydney (+91,573 versus +73,598 p.a.) and Melbourne (+87,768 versus +62,258 p.a.), sustaining structural demand pressures. And yet, dwelling approvals and completions in the current period fall short of prior-cycle benchmarks in every jurisdiction. The supply response, constrained by construction cost escalation, insolvency risk across the development sector, and elongated approval timelines, has not kept pace. Queensland presents a particularly pronounced divergence: economic growth at 2.2%, household spending at 6.9%, and unit price growth at 13.1%, well above the pre-COVID decade average of just 0.3% p.a. This repricing has occurred without a commensurate improvement in supply, compressing affordability rapidly. The ACT, by contrast, exhibits more moderate dynamics. Stable migration, contained completions, and price growth that has recently turned negative are features consistent with a market approaching equilibrium rather than structural strain. Across all four markets, the current environment is characterised by demand (indicated by population growth and household formation) above long-run norms, and supply below them. This combination is supportive of underlying asset values. It does not preclude near-term cyclical volatility as affordability constraints intensify.
Affordability: A Reframed View
Recent data necessitates a reassessment of relative affordability positioning across capital cities. Brisbane, previously characterised as a lower-cost alternative to southern markets, is now firmly established as Australia’s second most expensive capital by median dwelling value. At approximately $1.08 million, it sits materially above Melbourne at approximately $826,000.
Serviceability metrics reinforce this shift. Brisbane now ranks among the least affordable capitals on an income basis, with mortgage servicing ratios typically exceeding 50% for new entrants. The demand narrative remains strong; however, the affordability buffer that previously underpinned it has been eroded.
This adjustment is important. Markets can simultaneously exhibit strong structural demand and elevated affordability risk. Treating these as mutually exclusive is a category error.
Rate Elevation: Yield Expansion and Risk Accumulation
The relationship between rising rates and private credit returns is inherently two-sided.
On one hand, higher base rates enhance income through mechanical repricing, while bank retrenchment continues to expand the non-bank lending opportunity set. Pricing power and covenant quality have improved across new originations.
On the other hand, borrower stress is rising. Incremental rate increases continue to expand the cohort of households at risk, while transaction volumes are moderating as affordability constraints intensify. Development timelines are extending, and cost pressures—particularly in Queensland—are creating latent feasibility risks on projects underwritten in prior periods.
Importantly, these dynamics are not symmetrical in timing. Yield benefits are immediate; credit risks emerge with a lag. Portfolios may therefore appear robust in the near term, while underlying exit assumptions are progressively tested.
This lag effect is central. The relevant question is not the level of yield generated today, but the durability of capital outcomes under forward affordability constraints.
The Affordability–Volatility Relationship
Structural undersupply provides support to valuations, but it does not eliminate cyclical volatility.
Markets that have experienced the strongest price growth are, by definition, most exposed to affordability compression. As borrowing capacity tightens, the marginal buyer pool contracts—reducing transaction velocity and increasing settlement risk.
Strong fundamentals and affordability stress can—and currently do—coexist. Understanding that interaction is critical to credit selection, particularly where exit assumptions depend on depth of demand rather than absolute scarcity.
State Perspectives
The interaction between population growth, supply constraints, and affordability pressures is producing increasingly differentiated outcomes across the major East Coast jurisdictions of Australia where Harbour Credit Partners focuses its lending activity at present. The opportunity set remains, but the drivers of risk are no longer uniform.
Queensland — Compelling, but less forgiving
Queensland continues to exhibit the strongest demand dynamics nationally, supported by interstate migration and infrastructure investment. The supply position remains deeply constrained. However, rapid price appreciation (~9–12% p.a. through 2020 – 2024) has materially eroded affordability, with Brisbane now among the least affordable capitals on a serviceability basis. Construction costs are rising fastest in this market, and feasibility assumptions set in earlier periods are increasingly exposed. The structural case remains intact; execution on new developments now requires greater care.
New South Wales — Depth over momentum
New South Wales remains characterised by severe undersupply, with completions well below household formation. This creates a strong foundation of support for property values. However, affordability is stretched, and further rate increases continue to compress the active buyer pool. Transaction velocity (ie. the time and cost to sell a property), rather than nominal valuation, is the critical variable. A well-located asset in a genuine undersupply pocket remains fundamentally different to a marginal or specialised property reliant on thin buyer pools.
Victoria — Improving, with constraints
Victoria is in a recovery phase. Population growth has re-accelerated following the post-COVID period, reaching 2.7% in 2024 and 1.8% in 2025. This has coincided with flat to negative price growth, resulting in a relative improvement in affordability compared to other capital cities.
The forward supply pipeline is tightening after a sustained period of reduced approvals, providing a more constructive medium-term backdrop. Vacancies remain low across many (but not all) metropolitan areas, implying a favourable demand dynamic relative to supply for housing. However, the land tax regime continues to shape investor behaviour and weighs on exit liquidity across certain asset types.
Our assessment is that while conventional cyclical risks may be more muted than in less affordable markets, valuation stability remains contingent on continued population inflows and a constrained supply response.
ACT — Stable, with segmentation
The ACT presents a more stable profile, supported by a high-quality, public sector-dominated income base. Affordability risk remains moderate. Market conditions are bifurcated, with a tight detached housing segment alongside pockets of apartment oversupply. The investment case is less about growth and more about income resilience and predictability.
HCP View
It should be noted that the above analysis does not contemplate a significant macroeconomic event resulting in recession. While interest rates are expected to rise further over the next twelve months and household indebtedness remains elevated by global standards, the possibility of a macro shock disturbing these trends cannot be dismissed. This is not our base case. However, as John Maynard Keynes is widely credited as saying, “When the facts change, I change my mind. What do you do, sir?”
We remain active, but deliberately selective. The disconnect between household income and housing prices has scarcely been as vast as at present and is exacerbated by a rising rate environment.
The structural supply imbalance persists, and the current rate environment supports attractive income generation on our loans. At the same time, affordability constraints are now a defining feature of the market and introduce risks that are not captured by backward-looking performance.
This is not a cycle that rewards passive exposure. It rewards precision: in valuations, in market selection, in structure, and in borrower assessment.
The opportunity set remains compelling. The discipline required to capture it has increased.
About Harbour Credit Partners
Harbour Credit Partners is a Sydney-based private real estate loans manager and a joint venture with a local single-family office. Wholesale investors are eligible to coinvest in specific loans settled by the HCP investment team in the Harbour Credit Partners Master Trust, or to invest in a diversified pool of underlying loans via the Harbour Credit Partners Diversified Mortgage Fund (which was recently awarded a “Very Strong” rating by Foresight Analytics.)
For a complete list of HCP’s current active loan portfolio (including those opportunities where the capacity available to external investors has been exhausted), please access the following link:https://harbourcreditpartners.portal.agorareal.com/#/public/offerings
Please contact Jonathan Goll, Head of Investor Solutions, with any questions or comments that you might have, or should you need assistance with setting up an account and applying for investment with the firm.
Jonathan Goll Head of Investor Solutions
M: +61 438 082 247
E: jgoll@harbourcreditpartners.com
Level 5, 131 Macquarie Street, Sydney NSW 2000
Principal Data Sources
ABS: National, State and Territory Population (June 2025); Building Approvals Australia (January 2026); Total Value of Dwellings (December 2025)
Cotality (CoreLogic): Home Value Index, released February 28, 2026; Housing Affordability Report 2025 (November 2025); ANZ-CoreLogic Housing Affordability Report
YourMortgage.com.au: Median house prices by capital city, February 2026 (sourced from Cotality HVI)
National Housing Supply and Affordability Council: State of the Housing System 2025 (May 2025)
Reserve Bank of Australia: Financial Stability Review October 2025; Cash Rate Target decisions February–March 2026
Roy Morgan: Mortgage Stress Research, December 2025 and modelled forward scenarios
Altus Group: Australian Construction Price Outlook Q4 2025
NAB: Quarterly Australian Residential Property Survey Q1 2025
Domain: Forecast Report 2026; KPMG Australia: Residential Property Forecasts 2025–26
MacroBusiness: Housing supply pipeline analysis (January–February 2026)
ASIC: Construction sector insolvency statistics to February 2026
This document has been prepared by Harbour Credit Partners Pty Ltd for information purposes only and does not constitute an offer, invitation, solicitation or recommendation to subscribe for or acquire any financial product. Any such offer will be made solely by way of a formal offer document, which should be read in its entirety before making any investment decision.
The information contained in this document is general in nature and has been prepared without taking into account your objectives, financial situation or needs. Before acting on any information in this document, you should consider its appropriateness having regard to your circumstances and seek independent financial, legal and tax advice.
This document is intended solely for wholesale clients, as defined under the Corporations Act 2001 (Cth), and must not be distributed to or relied upon by retail clients. By receiving this document, you represent that you are a wholesale client.
While all reasonable care has been taken in preparing this document, no representation or warranty, express or implied, is made as to the accuracy, completeness or reliability of the information. The information is subject to change without notice and Harbour Credit Partners Pty Ltd is under no obligation to update this document.
Any forward-looking statements, projections or forecasts are based on current assumptions and expectations and are subject to risks, uncertainties and other factors that may cause actual results to differ materially.
All investments involve risks, including the possible loss of capital. Past performance is not a reliable indicator of future performance.
This document may not be reproduced, distributed or published by any recipient for any purpose without the prior written consent of Harbour Credit Partners Pty Ltd. Distribution of this document may be restricted by law in certain jurisdictions, and persons into whose possession this document comes should inform themselves about, and observe, any such Harbour Credit Partners Pty Ltd is the investment manager of the Harbour Credit Partners Master Trust. It is a Corporate Authorised Representative (CAR No. 001308393) of Quay Wholesale Fund Services Pty Ltd (AFSL No. 528 526) and is authorised to provide general financial product advice only.